Data
centers
The buildings where the internet lives and AI is trained: how much electricity and water they use, and what changes where they're built.
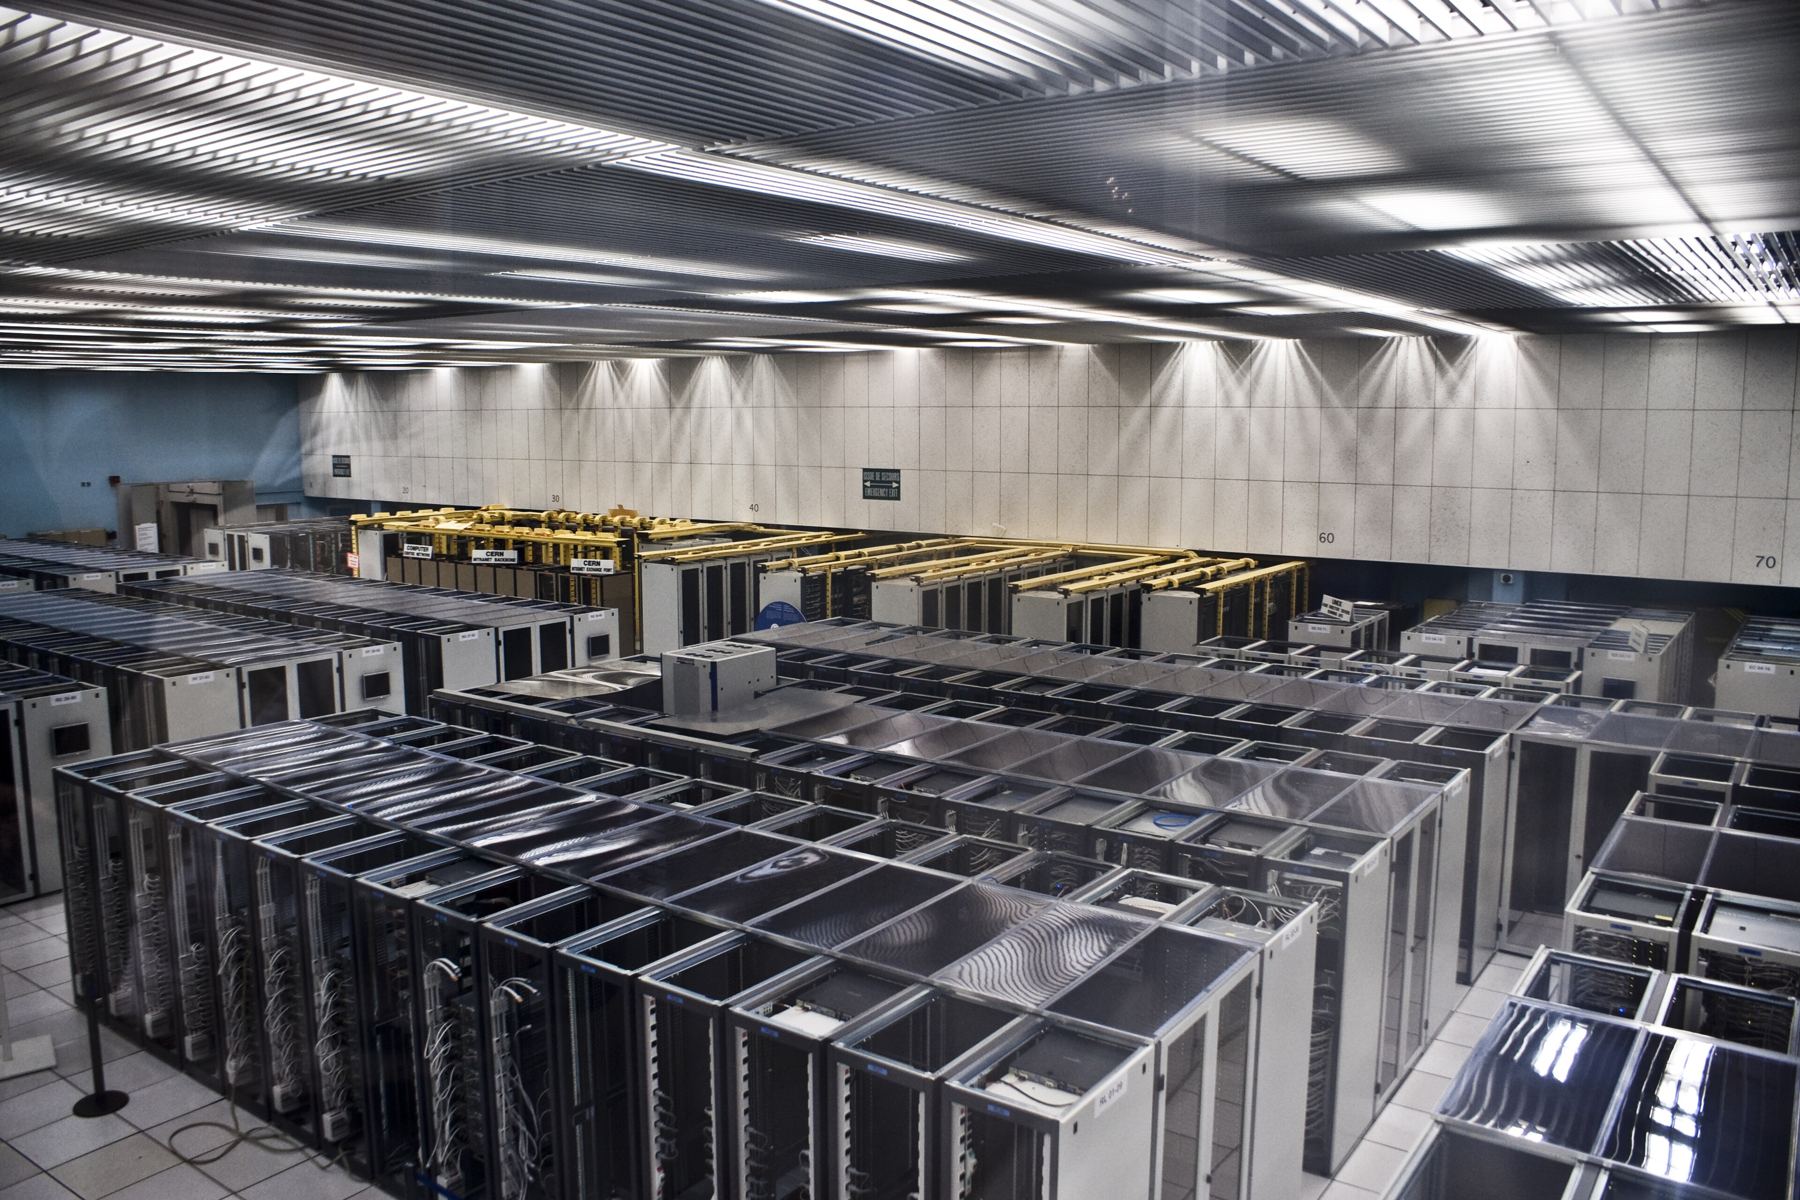 Photo: Florian Hirzinger · CC BY-SA 3.0

02Pros and cons
The most-cited arguments for and against, each with a figure and its source.
Tap a card to see its source.
Pros
~60TWh/yr, 2014–2016Proven efficiencyUS use stayed nearly flat while the industry grew, thanks to cloud consolidation, better cooling and better-utilized servers.2
EnergySource 2: 2024 United States Data Center Energy Usage Report — Lawrence Berkeley National Laboratory (LBNL) · Dec 2024.
$1.2billion · FY2026Local revenueTaxes paid by data centers in Loudoun County, Virginia: 39% of the county budget.6
Economy and jobsSource 6: Data Centers: The Loudoun Story — Loudoun County, Virginia · data as of Mar 1, 2026.
4.7million jobs · 2023Jobs and economyDirect, indirect and induced US jobs, plus $727 billion in GDP, per a PwC study commissioned by the industry.7
Economy and jobsSource 7: Economic Contributions of Data Centers in the United States, 2017–2023 — PwC for the Data Center Coalition (industry association) · Feb 2025.
50 %of the growthMore renewablesHalf of the increase in their demand would be met by renewables in the IEA base case.5
EnergySource 5: Energy and AI — Executive summary — International Energy Agency (IEA) · Apr 2025.
~10 %of global growthLimited shareThey account for about a tenth of global electricity demand growth to 2030, less than air conditioning or electric vehicles.5
EnergySource 5: Energy and AI — Executive summary — International Energy Agency (IEA) · Apr 2025.
−20 %demand in 2035Room for efficiencyIn the IEA High Efficiency Case, 2035 demand would be 20% lower than in the base case.5
EnergySource 5: Energy and AI — Executive summary — International Energy Agency (IEA) · Apr 2025.
No points on this side in this category.
Cons
6.7–12 %of US electricity · 2028Rising power demandProjected range for 2028, up from 4.4% in 2023.2
EnergySource 2: 2024 United States Data Center Energy Usage Report — Lawrence Berkeley National Laboratory (LBNL) · Dec 2024.
$7.27billionCapacity costsIncrease attributed to data center load in PJM's 2026/2027 capacity auction (+82.1%), per its independent market monitor.8
Economy and jobsSource 8: Analysis of the 2026/2027 RPM Base Residual Auction — Part A — Monitoring Analytics, Independent Market Monitor for PJM · Oct 1, 2025.
300Mt CO₂ · 2035Rising emissionsEmissions from their electricity would rise from 180 to 300 million tonnes in the base case; among the fastest-growing sources.5
ClimateSource 5: Energy and AI — Executive summary — International Energy Agency (IEA) · Apr 2025.
3×water, 2014–2023More waterDirect US consumption rose from 21.2 to 66 billion liters.2
WaterSource 2: 2024 United States Data Center Energy Usage Report — Lawrence Berkeley National Laboratory (LBNL) · Dec 2024.
<150permanent jobsFew permanent jobsEven at the largest sites; construction creates more jobs, but temporary ones.3
Economy and jobsSource 3: From Energy Use to Air Quality, the Many Ways Data Centers Affect US Communities — World Resources Institute (WRI) · C. D. Walker, I. Goldsmith · Feb 17, 2026.
~20 %of projectsGrid strainShare of planned projects that could be delayed by grid constraints, per the IEA.5
EnergySource 5: Energy and AI — Executive summary — International Energy Agency (IEA) · Apr 2025.
No points on this side in this category.
Order does not indicate importance. Sources include public agencies, labs, local governments, the power market monitor, think tanks and an industry-commissioned study (PwC for the Data Center Coalition). Figures from different sources measure different things: for example, economy-wide jobs versus permanent jobs per site.
03Electricity
World data center electricity use
TWh. Switch views: observed, the base projection or the IEA's 2035 scenarios.
| TWh | |
|---|---|
| 2024 | ~415 |
| 2030 (base) | ~945 |
| 2035 (base) | ~1,200 |
| 2035 high efficiency | ≈960 |
| 2035 all cases | 700–1,700 |
Source: IEA, Energy and AI1,5. “High efficiency” ≈960 TWh is our calculation from the IEA's 20% figure.
US data centers
TWh per year. 2018 and 2023 are consumption estimates; for 2028, LBNL gives a low and a high scenario.
| TWh | % | |
|---|---|---|
| 2018 | 76 | 1.9 |
| 2023 | 176 | 4.4 |
| 2028 low | 325 | 6.7 |
| 2028 high | 580 | 12.0 |
Source: LBNL, 2024 United States Data Center Energy Usage Report2
The IEA projects global use will roughly double by 2030, driven mostly by accelerated servers for AI.1
04Water
Direct water consumption in the US
Billions of liters per year, mostly for cooling.
| billion liters | |
|---|---|
| 2014 | 21.2 |
| 2023 | 66 |
Source: LBNL2
05Calculator: what does it equal?
Pick a data center's size and how much of its capacity it uses on average.
Formula and assumptions
- Annual energy (MWh) = MW × 8,760 hours × utilization.
- Homes = energy ÷ 10,791 kWh, the average annual use of a US residential customer in 2022.9
- Direct water ≈ energy × 0.375 L/kWh: US average in 2023 (66 billion liters ÷ 176 TWh), our calculation from LBNL data. Many sites use far less water, others more.2
This is a simple estimate, not a real site's figure. For reference, the IEA says a typical AI-focused data center uses as much electricity as 100,000 households, and the largest under construction 20 times more.5
06Local impacts
What the World Resources Institute (WRI) reports for the US. These are figures WRI compiles from third parties.3
US data centers
Includes operating, planned and under-construction sites (January 2026); about 37% of the world total.3
permanent jobs
Even the largest, per a review of 1,200+ sites; construction creates more temporary jobs.3
towns with NDAs
Virginia municipalities with non-disclosure agreements with developers, in a review cited by WRI.3
- Power bills: some states and utilities create special rates for large users so costs aren't shifted to households.3
- Air and noise: backup generators and gas turbines emit pollutants; cooling and generator noise has drawn complaints from neighbors, for example in Loudoun County, Virginia.3
- Public revenue: they pay taxes, though many places offer tax incentives that reduce that gain.3 In Loudoun County, Virginia, home to the world's largest concentration of data centers, they contributed $1.2 billion in fiscal 2026 (39% of the budget); the county says it is working to diversify its revenue so as not to depend on them.6
- Jobs: Loudoun reports more than 17,000 direct and indirect data center-related jobs, along with residents' concerns about water, noise, air quality and aesthetics.6
“Little is known about long-term health outcomes in data center host communities.”Tao and Gao, Eco-Environment & Health (2025), calling for more empirical research407Myth or fact?
1Data centers use more than half of the world's electricity.
Show answer
Myth. They used about 1.5% in 2024 (about 415 TWh).1
2In the US, their electricity use stayed nearly flat between 2014 and 2016.
Show answer
Fact. It hovered around 60 TWh a year thanks to efficiency gains.2
3They will account for most of the growth in global electricity demand to 2030.
Show answer
Myth. Per the IEA, about a tenth; in the US, however, nearly half.5
4Their direct water use in the US tripled between 2014 and 2023.
Show answer
Fact. It went from 21.2 to 66 billion liters.2
08FAQ
How much is 415 TWh?
Is AI driving the growth?
Why ranges instead of one number?
Do they create many jobs?
Do all data centers use a lot of water?
09Sources
- Energy and AI — Energy demand from AIInternational Energy Agency (IEA) · Apr 2025 · Accessed Nov 8, 2026
- 2024 United States Data Center Energy Usage ReportLawrence Berkeley National Laboratory (LBNL) · Dec 2024 · Accessed Nov 8, 2026
- From Energy Use to Air Quality, the Many Ways Data Centers Affect US CommunitiesWorld Resources Institute (WRI) · C. D. Walker, I. Goldsmith · Feb 17, 2026 · Accessed Nov 8, 2026
- Global data center expansion and human health: A call for empirical researchY. Tao, P. Gao · Eco-Environment & Health · PubMed Central · 2025 · Accessed Nov 8, 2026
- Energy and AI — Executive summaryInternational Energy Agency (IEA) · Apr 2025 · Accessed Nov 8, 2026
- Data Centers: The Loudoun StoryLoudoun County, Virginia · data as of Mar 1, 2026 · Accessed Nov 8, 2026
- Economic Contributions of Data Centers in the United States, 2017–2023PwC for the Data Center Coalition (industry association) · Feb 2025 · Accessed Nov 8, 2026
- Analysis of the 2026/2027 RPM Base Residual Auction — Part AMonitoring Analytics, Independent Market Monitor for PJM · Oct 1, 2025 · Accessed Nov 8, 2026
- How much electricity does an American home use?U.S. Energy Information Administration (EIA) · updated Jan 8, 2024 · Accessed Nov 8, 2026
- File:CERN Server 03.jpg (Florian Hirzinger, CC BY-SA 3.0)Wikimedia Commons · Accessed Nov 8, 2026
- Creative Commons Attribution-ShareAlike 3.0Creative Commons · Accessed Nov 8, 2026
Figures for 2024 and earlier are the sources' estimates; 2028 and 2030 figures are projections or scenarios. Citing a source does not imply endorsing its conclusions.